
Spiders and Clouds
It’s interesting to consider how words can be compared, contrasted, and manipulated through the use of graphic renderings. One way I’ve created crystallizing images with words is through the use of word clouds. I’ve just read some information about the use of spider-grams as an alternative way to render information, something that I’d like to explore, possibly as a way of seeing change over time.
I’ve been spending time coding and analyzing the interview data and digital artifacts for this research work. As a result, I have a collection of word clouds from the interviews that I’ll examine more closely. These word clouds are curated from each individual interview, as well as a word cloud that collects all the key terms from each of the eleven interviews I’ve conducted so far. These key terms are generated by Otter.ai software from the transcriptions of the audio file from the interview, so should be unbiased. (Thought: While I don’t know the underlying algorithm that determines how these key terms are created, I am nonetheless using these to shape my thinking about what topics emerge from the interviews.)
Here is the most recent rendering of these key terms
Key terms – by the numbers
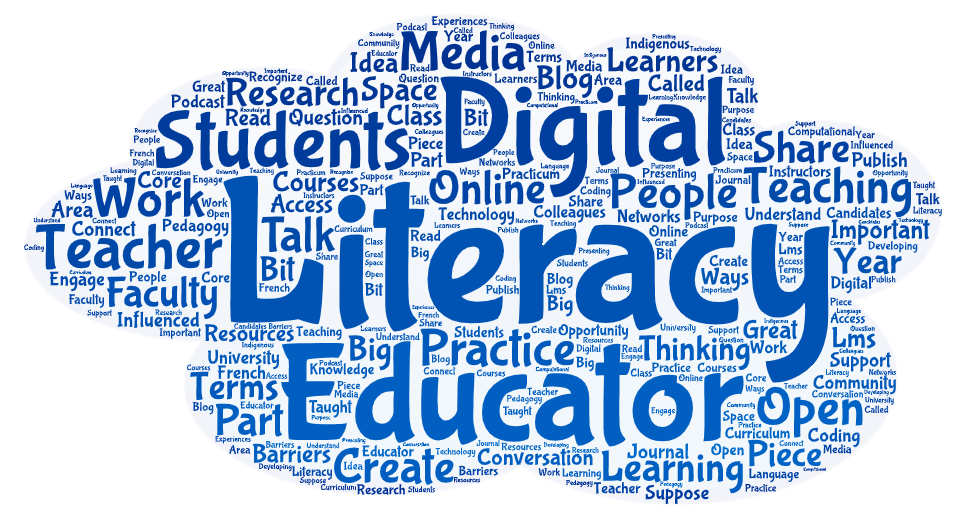
Here are the key terms as identified by the transcription software, collected and curated through Word Art word cloud software.
So what does this mean? Shouldn’t it be obvious that these are the key terms being used during these interviews since that is the core topic(s) being discussed? Wouldn’t it be disturbing if these key terms are not evident in the interviews since it would indicate that my research is not focusing on what I hope or should be researching? So, is this a form of validation that my research is truly examining what I want to examine?
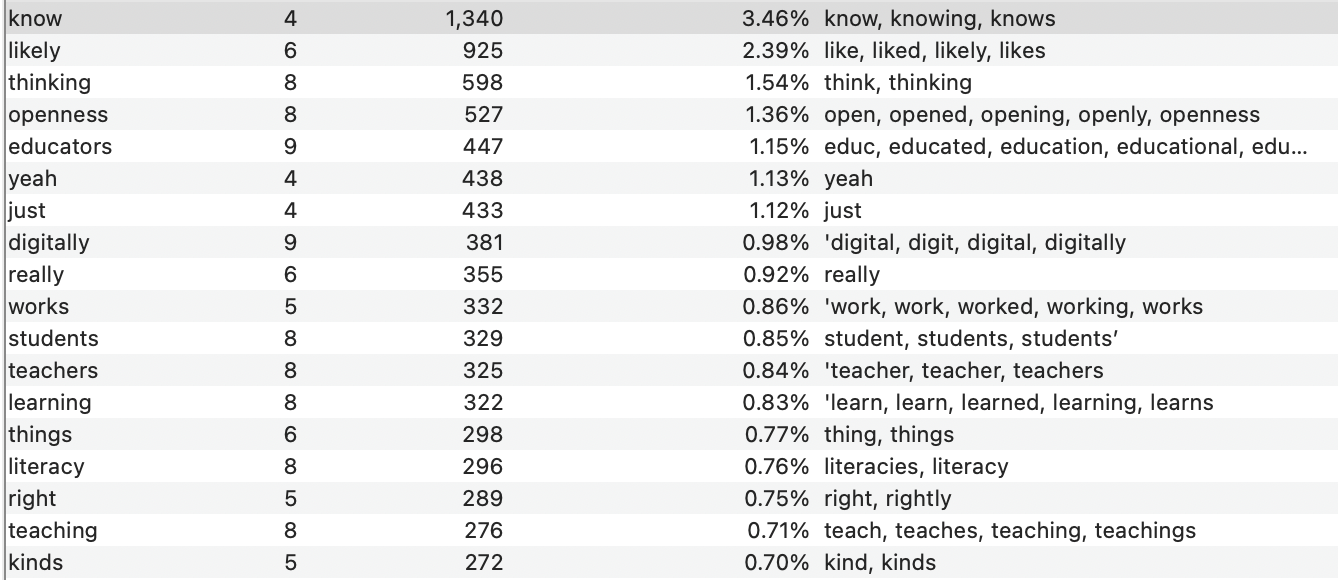
The use of a spider graphic for key terms or word frequencies, possibly showing the changing frequency over time, may also provide information and verification that topics within the interviews and within the codes are reflective of the purpose for this research. While I haven’t tried using a spider-gram yet, here is a snapshot of word frequencies in the current ‘project’ – this is from the full text of each of the interviews conducted to date, as well as words found in the digital artifacts that are text based reflections, since graphic or web-based reflections would not render into these word frequency counts. (These digital artifacts may best be captured in the coding done to bring these ideas into text vs graphic, audio, video, image, or interactive formats.)
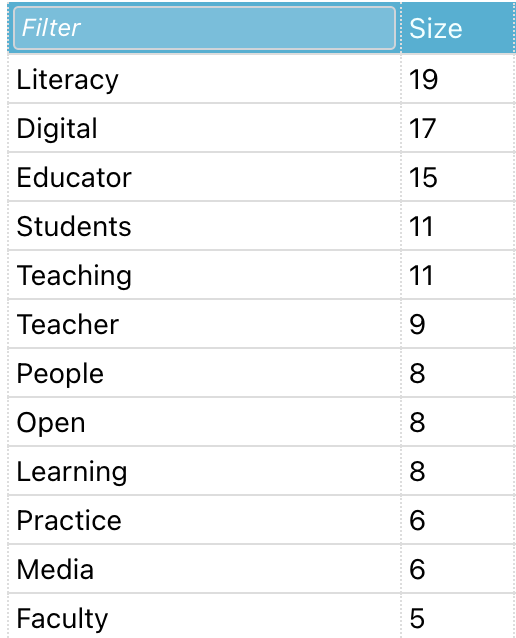
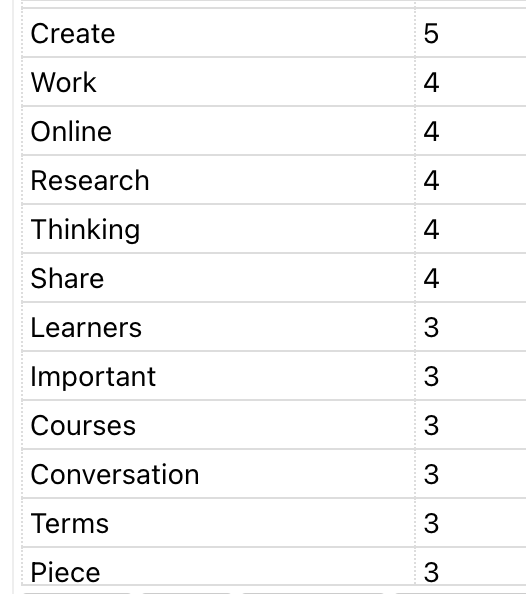
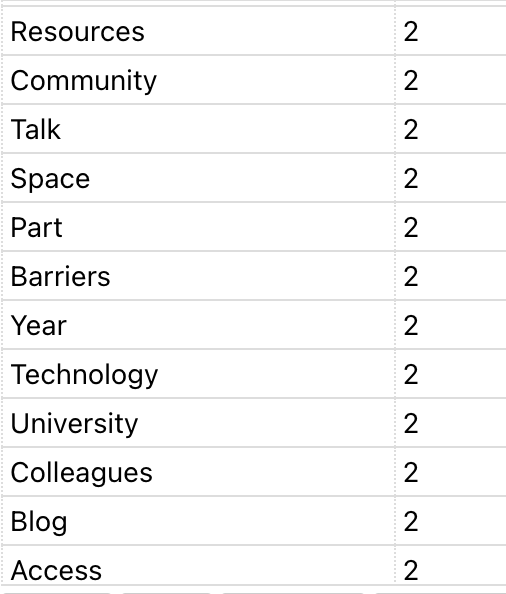
Key terms – by the numbers (Version 2)
Here are the words identified as key terms through a word count query using NVivo software where I am conducting the coding of interviews and digital artifacts.
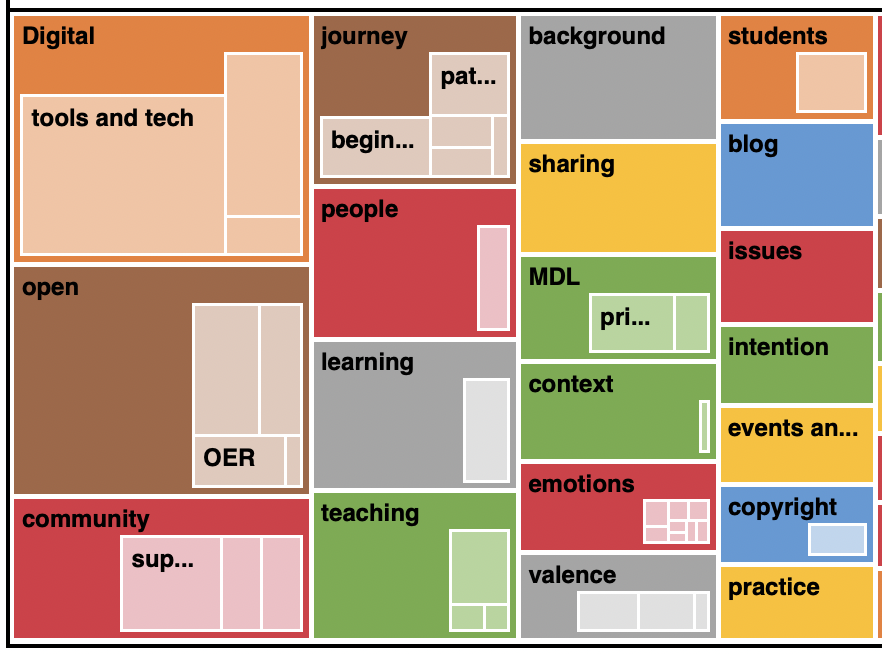
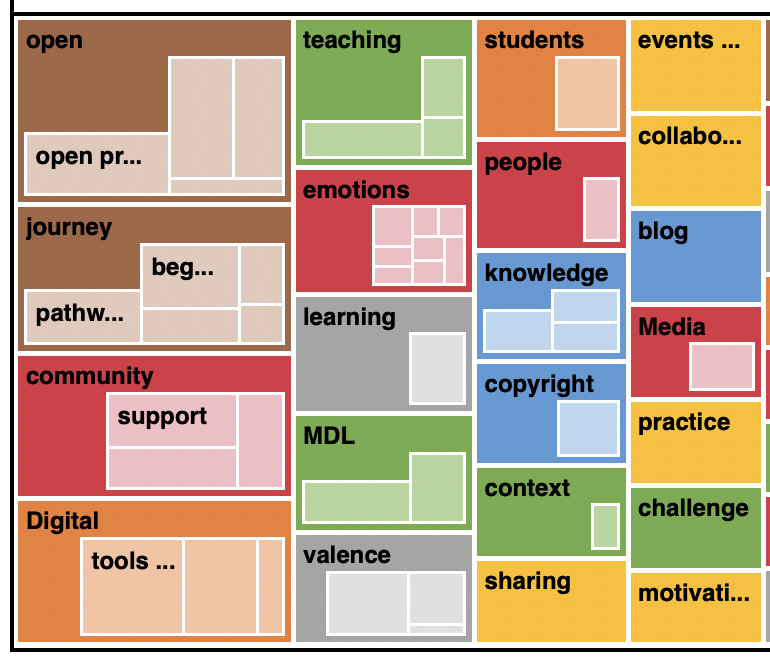
Key terms – by the codes
Here I explore the key terms by the codes being used – larger blocks indicate the frequency of those codes being used. Two versions are shown here – coding references and items being coded. These are produced through a query in NVivo software where I am coding the interviews and digital artifacts. Would this look different if I was using other CAQDAS (computer-assisted qualitative data analysis software). Is there inherent bias within this particular software that I am not seeing, or is the coding I am conducting inherently biased in my interpretation?
While this is preliminary and will not be reflective of the full body of research that I will analyze in the coming months, this is, in some small way, a validation that what I am researching is what is becoming evident in the research.
I think the open research method (blogging) about your coding and checking for bias/ accuracy could also be highlighted as a means of data validation? Well done ! So interesting !!!