Visualizing my data
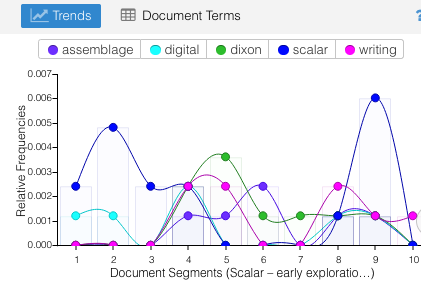
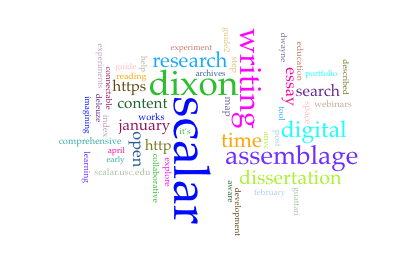
Recent reading, specifically Dave Kernohan’s blog post Baby’s first semantic blog citation metrics #oer16. This post included some explorations into ‘new to me’ visualization tools – Semantrometrics (which I haven’t fully explored yet), and Voyant Tools, which I took for a quick test today. Here are some images from this tool, using the URL links from a few posts from this blog site. First, one blog post on it’s own [Scalar – early explorations] resulted in some interesting observations.
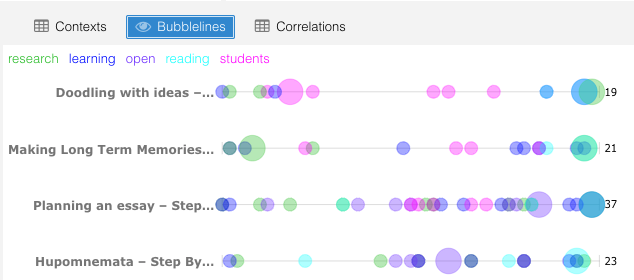
Then I tried Voyant tool with four blog posts that I had tagged with the word ‘visualization’:
- Doodling with Ideas – Sept 30, 2018.
- Making Long Term Memories – Oct 4, 2018.
- Planning an Essay – November 8, 2018.
- Hupomnemata – March 30, 2019.
Interestingly, from this inquiry into the content from this collection of blogs, I was able to gain insights on my writing, since the word ‘visualization’ did not appear to be in the top words in any of these blog posts. Here are images of the results:
Voyant Tools also creates a URL link to this collection which I will name My Visualizations.
I noticed from these visualizations that:
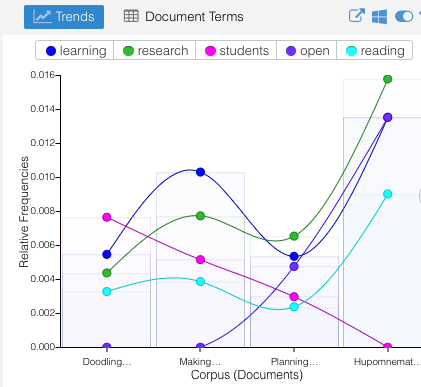
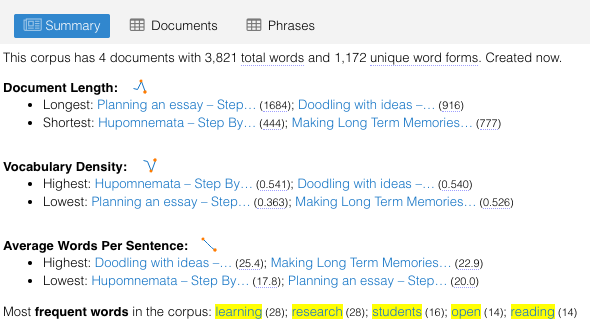
- the key words are not what I thought they would be, but they are nonetheless critical words to my thinking – students, research, learning, open, and reading are important
- while there were 3,821 words, only 1172 were unique word forms – I wonder how this would compare to essays I’ve written?
- vocabulary density is an interesting data point – mine range from .363 to .541 with average words per sentence ranging from 17.8 to 25.4
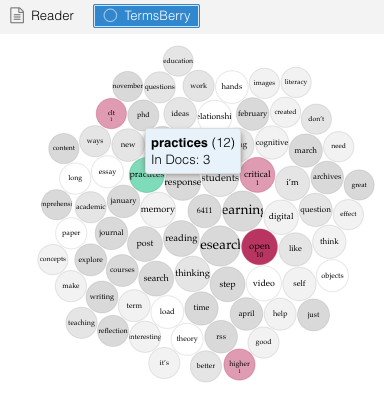
- the interactive ‘terms berry’ allows for a graphic analysis of key terms as they relate to other concepts e.g. practices was linked to critical, higher, and open
- the trends for terms across these four blog posts shows a dip in their application in the Planning an essay blog post and a steep incline in relative frequency in the Hupomnemata blog post.
All this has me wondering?
- How this would compare to an essay that I have written or a journal article I have co-authored.
- What words and terms will predominate in other blog posts or web documents?
- How does my data compare to other bloggers in academia – should that matter?
- Should I be putting academic papers through similar scrutiny?
- Worthy of future visualizations and compare/contrast opportunities.
Worthy of future visualizations and some compare/contrast opportunities.
