Playing with Crystallization
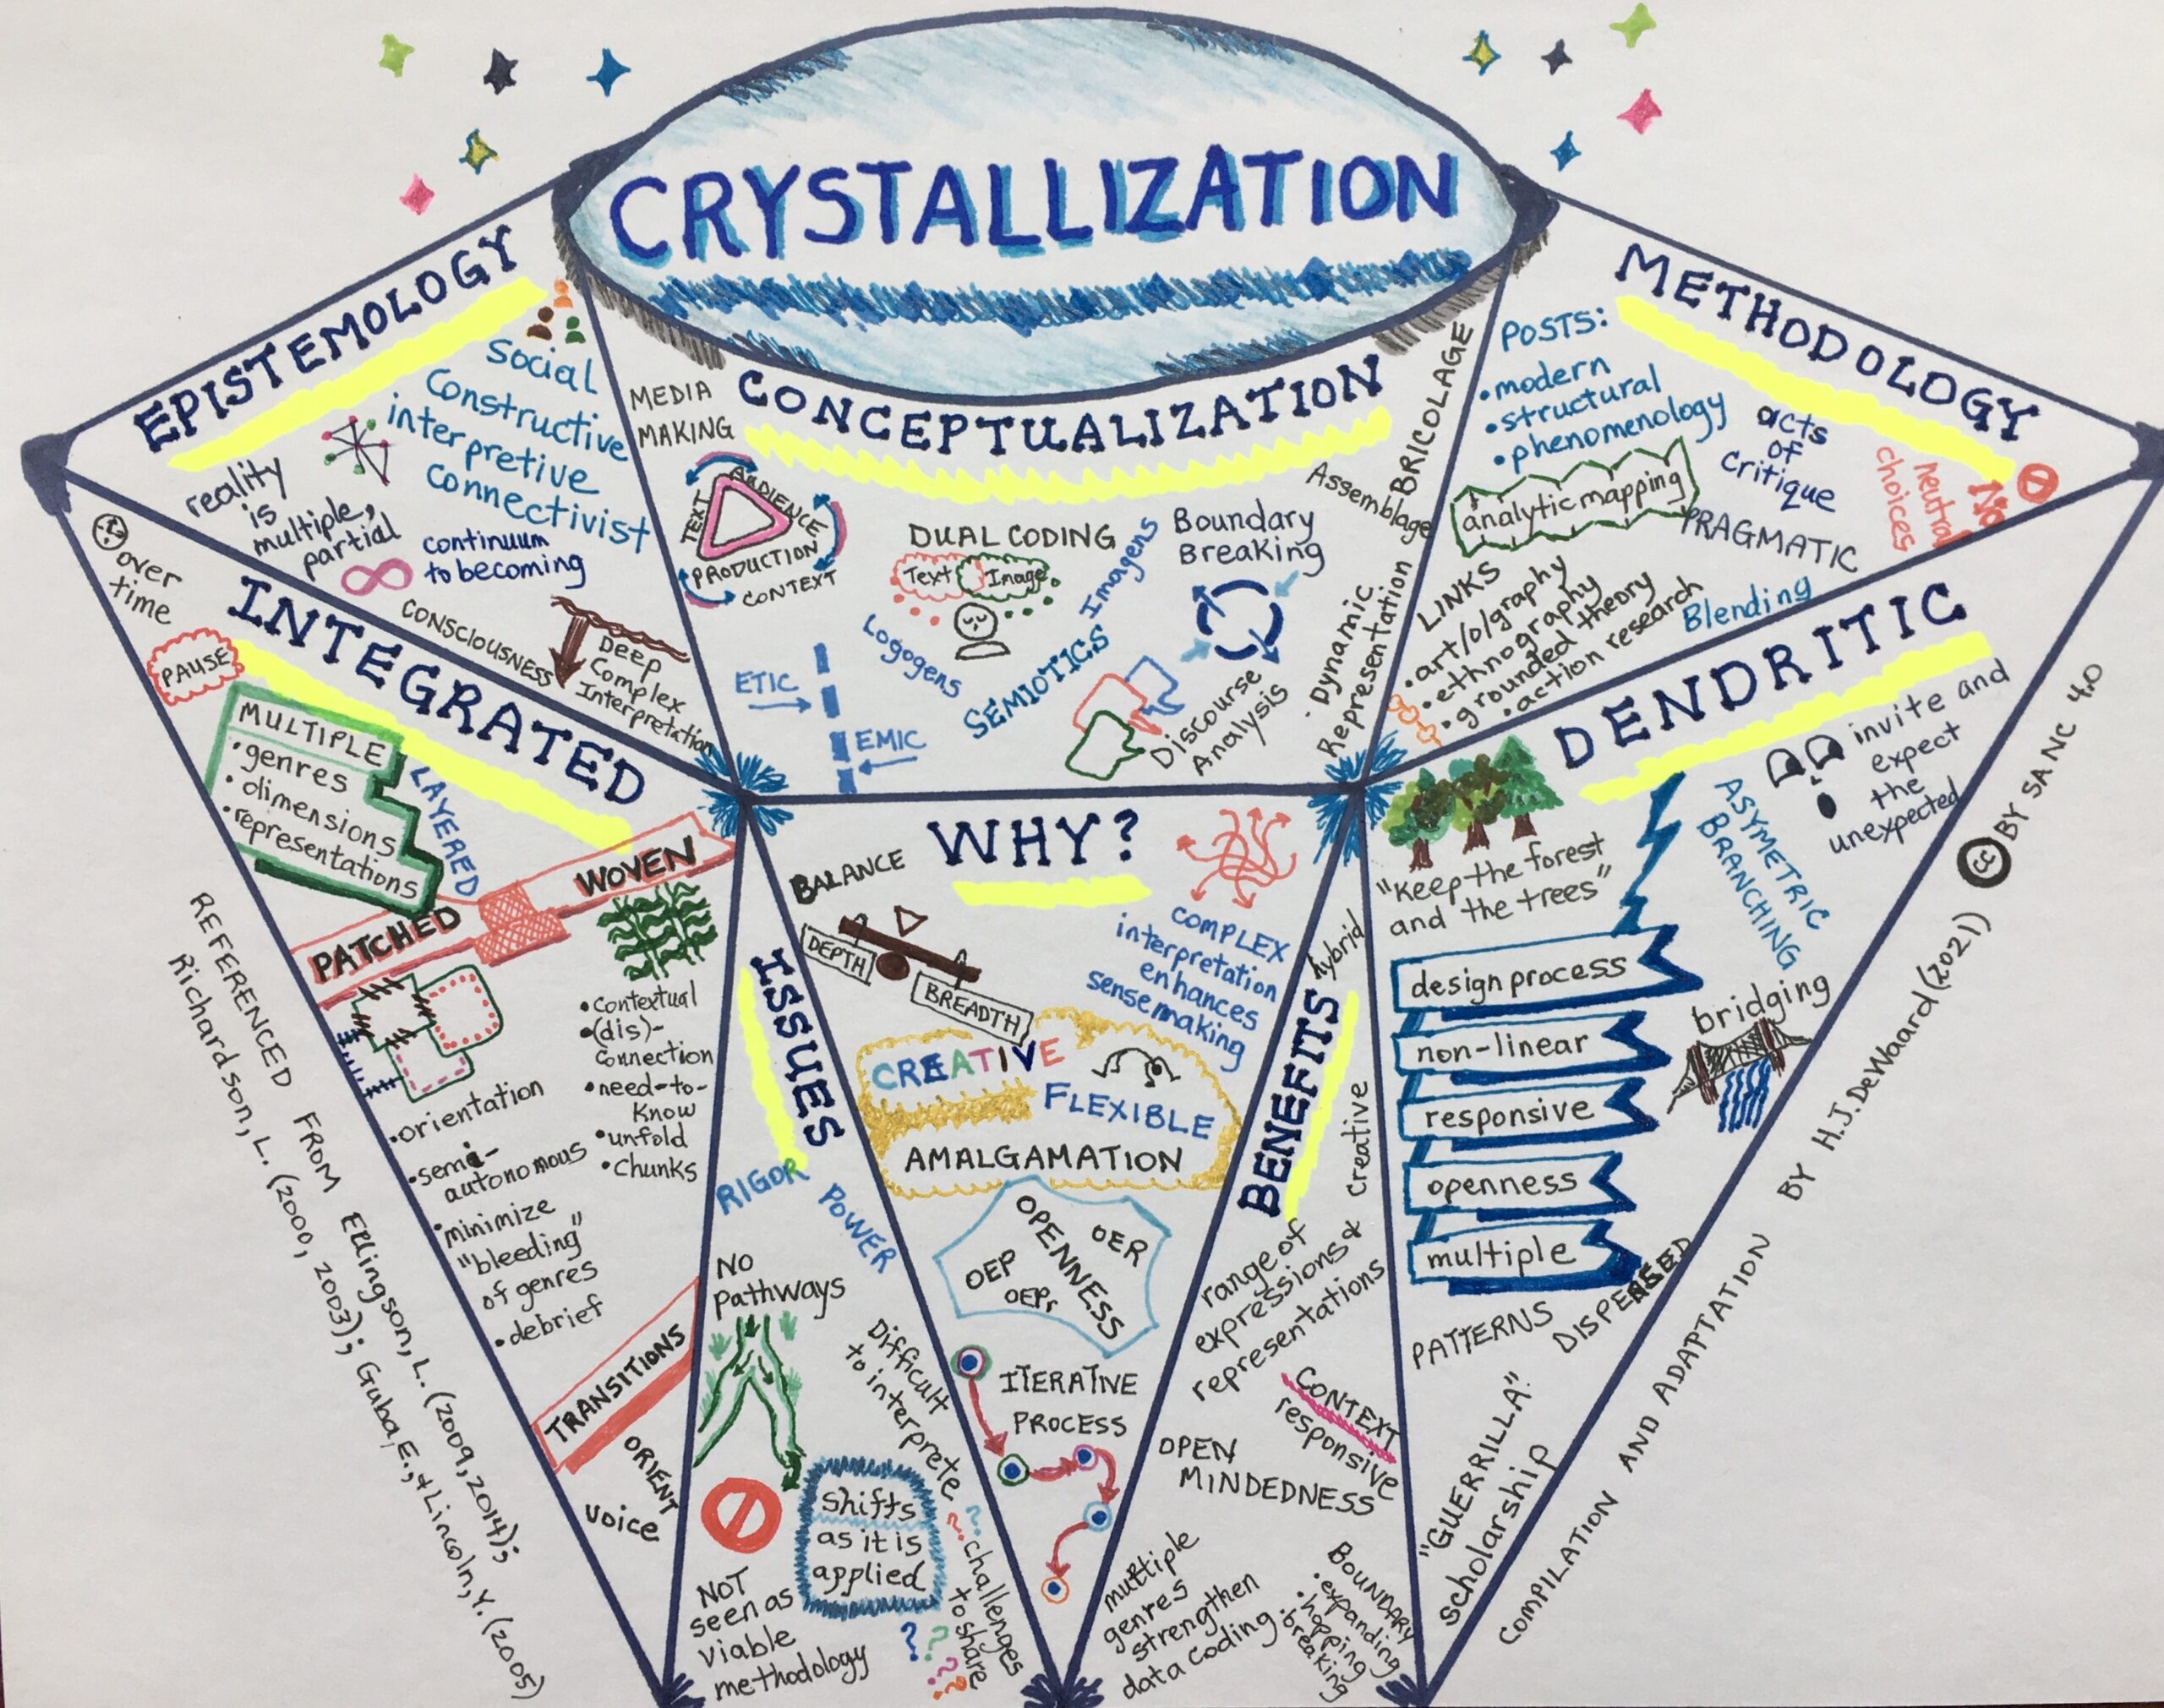
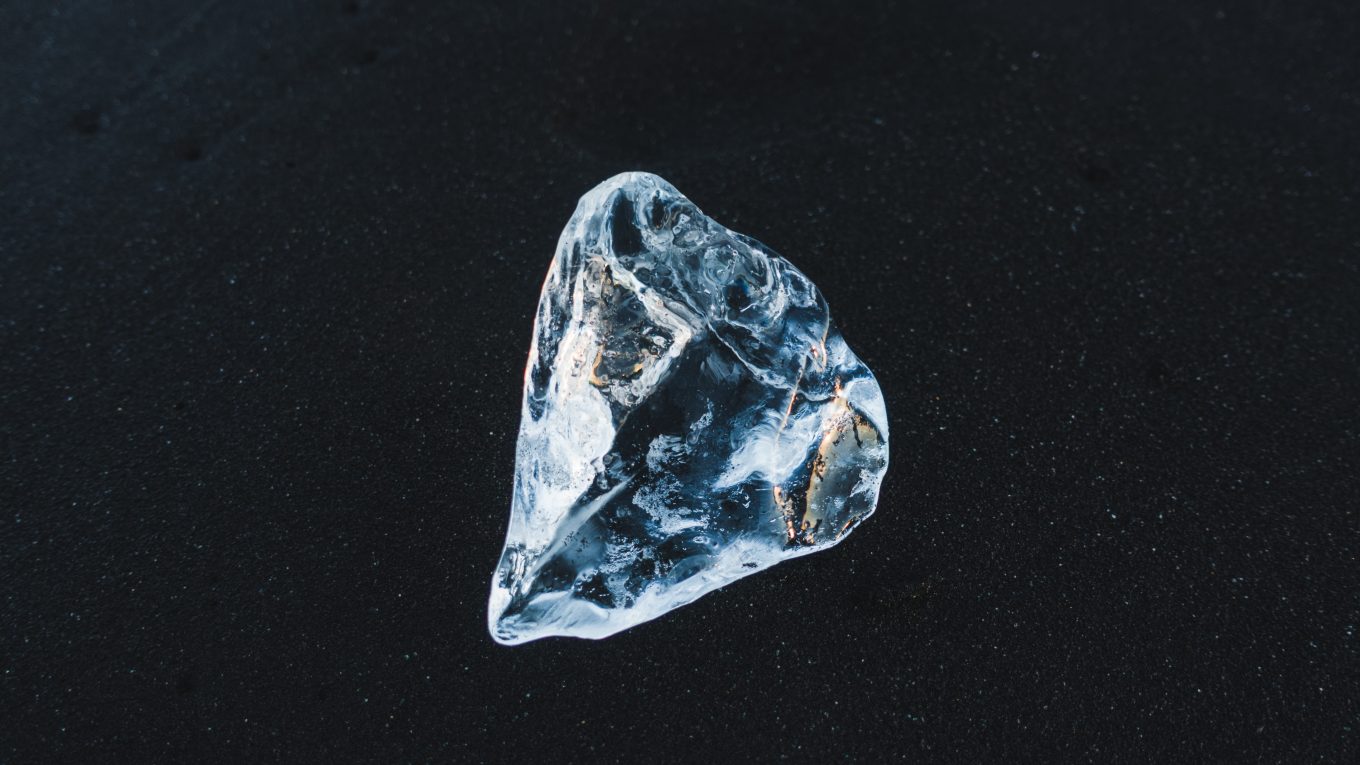
I’ve been reading and clarifying my understanding of the concept of crystallization (Ellingson, 2009, 2014; Richardson, 2003). I have created a graphic consolidation, a conceptual map of sorts, that pulls key ideas into focus. This is in an effort to support my research proposal and validate my core methodology for the research. This graphic rendering of the concept, drawing out the key elements, has taken over a year to ‘crystallize’. While there were many images that came to mind within the words and ideas, I was challenged to build the outlining structure of this visual map. I began by examining pictures of cracks in ice as a way to organize the information. I hoped to find one image that could become the background for the information, representative of crystallization with an element of fractalization, since fractals draw my imagination. With several possible background images, I began to organize the multiple ideas around this key term “crystallization” in a representative way, only to find that the words and icons did not fit into the image in a neat or logical way. I went back to my image searching only to realize that the ultimate crystallized formation is a diamond, so that became my chosen background shape, into which I could encapsulate the information about crystallization that I have found in my research.
Here is my final graphic rendering – done on paper with markers, gel pens, and coloured pencils. I hope to reproduce this in digital format using my favourite software, when time permits.